Building a Residual-Value Curve for an Accelerator Fleet
How NVIDIA's rapid chip cycles break traditional depreciation models for GPU fleets.
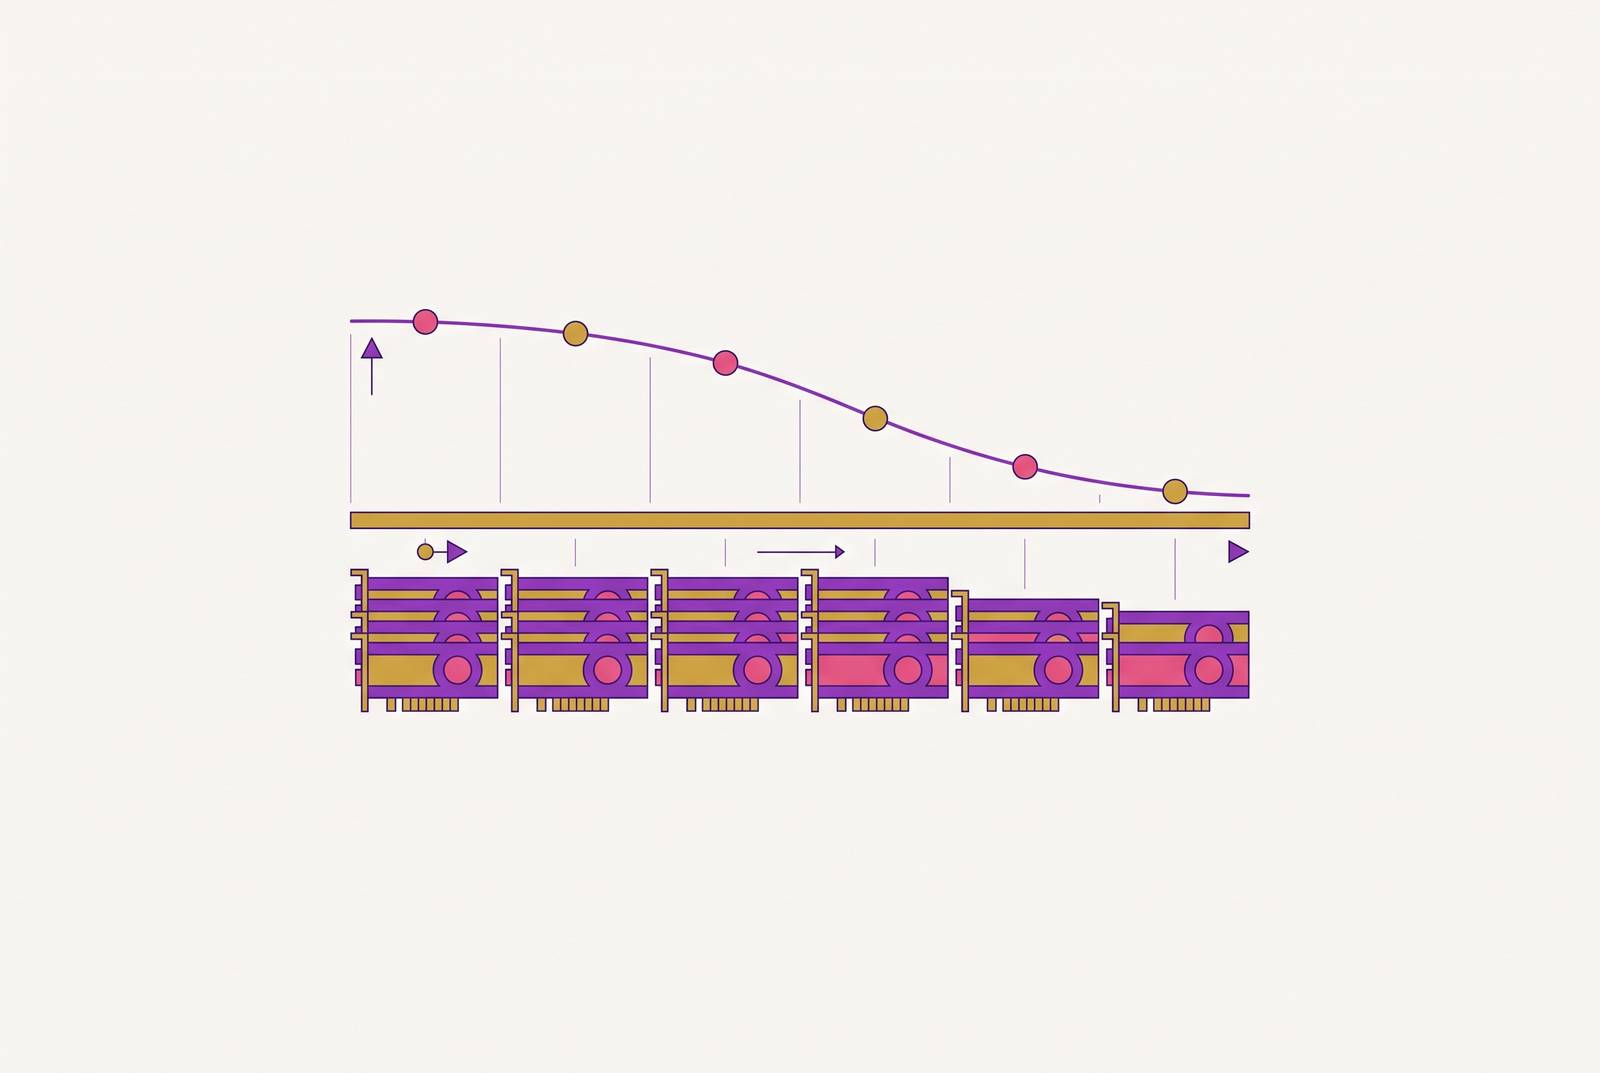
Residual value is the resale price of a piece of equipment as a percentage of its original cost at the end of a lease or loan term. For accelerators, that number now underwrites more than $100 billion in GPU-backed asset-backed securities and over $20 billion in loans collateralized directly by NVIDIA hardware. It has stopped being an internal accounting choice and become a market-moving assumption, and most of the industry still builds it the way people used to depreciate office copiers. That model is wrong, full stop, and the rest of this piece explains why.
Three constituencies carry that assumption, and they carry it differently, which matters more than most credit teams admit. A lender sets the worst-case recovery and the advance rate off the residual, and the risk only bites in default, but defaults and weak resale markets tend to arrive together, so a soft residual hurts most exactly when it's least convenient. A lessor books the residual on day one and then has to convert it to actual cash when the lease ends, so a weak resale market produces a loss even with zero defaults. Lessors are historically among the first hit by overbooking, killed off well before anyone else feels the impact. An equity investor experiences the same residual as upside, something that can push an internal rate of return from roughly 20% toward 35%. Overbooking there doesn't blow a hole in a balance sheet, it just costs return. Three very different exposures to one number, which is exactly why so few firms model it the same way.
The founding cautionary tale is IBM's mainframe business in 1979. IBM cut the price of its entry-level mainframe by 69% in a single announcement, from $233,900 to $71,650, and the used market repriced rapidly in response. Lessors who had booked aggressive residuals on the old pricing faced collapse in the years that followed. NVIDIA today ships roughly 90% of datacenter GPUs at above 70% gross margin, a structural position that makes an analogous price cut at least plausible. Given how severe that downside is, and how young this asset class remains, the rest of this piece builds a residual curve the way the data actually supports, step by step.
Why conventional depreciation schedules are the wrong starting point for accelerators
Accounting useful life and economic useful life are not the same thing, and treating them as interchangeable is where most of the trouble starts. Accounting useful life is a management estimate chosen for financial reporting. Economic useful life is the real-world stretch during which the asset stays competitive and actually earns money. A GPU can sit on a six-year depreciation schedule while going economically obsolete in year three, and nothing in the accounting forces anyone to notice.
Straight-line depreciation makes this worse, mechanically, and the mechanism is worth spelling out rather than waving at. Lengthen the assumed useful life and the periodic depreciation charge shrinks, reported operating income rises, and none of it touches EBITDA or cash flow. Run the math on a $10 billion fleet: at a four-year life, annual depreciation is $2.50 billion; stretch it to six years and that drops to $1.67 billion, an $830 million annual swing that moves straight through operating income and EPS without a single change to the underlying unit economics.
Hyperscalers have leaned on this lever hard, and the moves are documented in public filings. Microsoft, Google, and Oracle each stretched useful life from 4 to 6 years. Meta extended in steps up to 5.5 years. Amazon moved to 6 years in 2024, a change that cut depreciation and amortization expense by roughly $3.2 billion and added about $2.5 billion to net income, then reversed course back to 5 years effective January 1, 2025. That about-face should tell you how uncertain even Amazon is about the number it had just booked. CoreWeave runs 6-year cycles as a deliberate bet that inference workloads stretch the value-retention curve further out. Add it up across the hyperscalers and reported depreciation fell from $39 billion to $21 billion, a 46% drop driven by nothing but a change in assumption.
GAAP allows this. Auditor sign-off is required, and under GAAP these moves count as changes in accounting estimate applied prospectively, reflecting updated judgment rather than correcting a prior error. But the flexibility creates a real hazard on the ground: a "zombie fleet," hardware that keeps depreciating slowly on paper while its actual utilization collapses. Gaps between tracked asset status and actual utilization have surfaced at large operators, illustrating how deferred depreciation can accumulate invisibly. When a utilization gap like that surfaces, the deferred depreciation doesn't quietly reappear. It shows up all at once, through accelerated depreciation or an impairment charge, on exactly the quarter nobody wants it.
The deeper mismatch is architectural, and no amount of careful accounting fixes it. NVIDIA ships a new generation every 18 to 24 months, so a 6-year depreciation schedule spans roughly three full architecture cycles. Straight-line math has no way to represent the step-down in economic rent that lands every time a successor chip ships. The right model anchors to the hardware's actual income-generating capacity, a figure independent of a management estimate chosen for its effect on the income statement. That means building the curve up from its economic inputs rather than down from an accounting policy.
Anchoring the curve's starting point: what a GPU generation is actually worth at acquisition
As of mid-2026, four NVIDIA generations sit in commercial deployment at once. H100 (Hopper) is the most widely available, with secondhand cards trading at $12,000 to $18,000, down from roughly $40,000 at peak. H200, announced November 2023 and shipped Q2 2024, is a memory-upgraded Hopper variant built for memory-bound inference. B200 (Blackwell) ships as a DGX system priced around $275,000. B300, "Blackwell Ultra," shipped January 2026 with 288 GB of HBM3e, and the DGX B300 system runs $300,000 to $350,000.
None of this stands still, so the cost basis for a new fleet is a moving target before depreciation even enters the picture. Bloomberg Intelligence projects NVIDIA GPU average selling prices climbing from $19,000 in 2024 to $33,000, and AMD's from $12,000 to $29,000.
The input almost everyone gets wrong is technology age. Residuals have to be booked against the age of the technology, measured from the day a generation first reached buyers, with the clock tied to the generation's market debut regardless of when a given operator actually bought it. An H200 bought new today is already more than two years into its technology life, because that generation first shipped in 2024. Most smaller operators don't get flagship allocation at launch either: a Blackwell project signed today might not get racked for six months, which means financing closes on hardware that is already meaningfully into its technology life.
Run that forward and the consequence is stark. A 36-month loan on hardware with a 12-month technology age at closing is effectively a 48-month technology-age exposure, and the residual has to reflect that full exposure rather than the shorter clock the borrower's paperwork implies. Get the cost basis and technology age right, and the next problem is modeling how value actually decays across whatever life remains.
The empirical shape of GPU depreciation: what secondary-market data actually shows
Think of a GPU's life as a cascade through workload tiers, because that's what the resale data actually traces. Years 1 and 2 belong to frontier model training, the highest-value use case, which demands the latest generation available. Years 3 and 4 shift to production inference, where prior-generation performance is often still perfectly adequate: CoreWeave's CEO has noted that A100 chips from 2020 remain fully booked, and H100s coming off expired contracts get rebooked at 95% of their original pricing. Years 5 and 6 settle into batch processing and cost-sensitive inference, where latency stops mattering and economics take over.
AltStreet's January 2026 estimates put annual depreciation at 20 to 30% in year one, as next-generation chips launch, 15 to 25% in year two, as the new generation scales into production, and 15 to 20% in year three, as the prior generation shifts into secondary workloads. From year four on, the rate settles to 10 to 15% annually, approaching a terminal value of 10 to 20% of original purchase price.
Apply that to an actual H100 trajectory and the numbers get concrete fast. Bought at $35,000 to $40,000 during the 2023-2024 peak, the same card falls to $25,000 to $30,000 in year one (2025, coinciding with the B200 announcement), $15,000 to $20,000 in year two (2026, as B200 ramps), $10,000 to $15,000 in year three (2027, B200 saturation), and $5,000 to $10,000 by year four and beyond (2028+).
Secondary-market data from Servnet UK and CCIR in 2026 is the closest thing available to a measured per-generation depreciation rate, and it deserves more weight than the softer estimates above. On a posted-ask basis, roughly two years out, H200 141 GB hardware held 86.2% of its launch value, while H100 NVL 94 GB slipped to 76.6%. That roughly ten-point gap between adjacent generations is about as clean a signal as this market currently offers. Treat both numbers as ceilings, though: executed medians run more conservative, at $27,155 for H200 and $25,750 for H100 NVL. The H100 NVL posted-ask median sits at 132% of its executed median, meaning listed prices run almost a third above what buyers actually pay. That spread matters directly for impairment testing, because marking a book to posted-ask rather than executed price overstates recoverable value, and any lender pricing off listing data alone is pricing off the wrong number.
Zoom out to an 18-month window and the H100 retains somewhere between 60% and 83% of its value, a range that looks nothing like standard IT equipment depreciation and reflects the cascade effect keeping demand alive even for aging silicon. American Compute's dataset, covering 622,098 secondary-market units across 76,775 completed transactions, is large enough to fit a smooth curve to, but the firm's own conclusion is to publish residual bands instead of point estimates. That's the right call: fitting a single curve to a market this thin and this volatile produces an overbooked number that looks precise and isn't. The observed decay gives the curve its shape. What the hardware earns along the way, the rental income, gives the curve its level.
Building the income leg: forward rental rates and their role in the DCF
Rental rates have already moved enough to make the point on their own. H100 cloud rental fell from $8 to $10 per hour in early 2024 to roughly $1.80 to $3.50 per hour by Q2 2026, a decline of 64 to 75%. Within that broader slide, sharp reversals happen: H100 one-year contract pricing rose about 40% in five months, from $1.70 per hour in October 2025 to $2.35 per hour by March 2026. A model that assumes a smooth, monotonic decline misses volatility that shows up in actual signed contracts, well beyond what spot listings alone would suggest.
Pricing also splits hard by channel and by generation. B200 rates aren't standardized at all: roughly $6 per hour of compute on specialist clouds versus over $16 on hyperscalers, a 2.5x spread for identical silicon depending on who's renting it out. Blackwell spot rental reportedly jumped 48% in two months in early 2026. Meanwhile hyperscaler H100 rates fell 26 to 54% by region since Q1 2025 even as non-hyperscaler rates recovered, compressing the hyperscaler premium substantially from its prior roughly 250% level.
Workload type sets the floor under all of this, and the floor is what a residual model actually needs. Training work, price-insensitive and demanding cutting-edge hardware, commands a premium over inference, which is more cost-sensitive and increasingly commoditized. Below both sits a terminal floor set by consumer and hobbyist repurposing, which caps out at whatever a hobbyist will pay regardless of what the hardware is worth to an enterprise.
Silicon Data's model handles this by pulling rental rates directly from a 36-month forward curve built on real-world GPU rental data; beyond 36 months, it holds the last observed rate and applies a compounding tail decay. That's the practical mechanism for swapping a theoretical depreciation schedule for market-implied pricing instead of a guess. The market is moving toward formalizing this further: ICE has announced plans with Ornn to launch cash-settled GPU compute futures referencing a compute price index across H100, H200, B200, and RTX 5090 capacity. Once multiple venues publish a forward price for GPU compute, the residual-value question stops being an internal accounting matter and becomes a mark-to-market reference a lender can point to in a term sheet. With rental rates established as the income driver, two adjustments remain before the model produces a number anyone can lend against: utilization decay and the discount rate.
Modeling utilization decay and the generational step-down as continuous functions
The underlying DCF structure is straightforward once the inputs are right. At each increment of remaining life, the model computes rental rate times a discount factor times one minus the operating cost ratio, and summing those increments across the expected useful life produces the residual.
Utilization decay is where the generational step-down actually gets modeled, and it belongs as a continuous function, smoothing what would otherwise show up as discrete annual cliffs. Silicon Data's model uses exponential decay of the form k times e to the power of negative rt, where k is current utilization, r is the decay rate, and t is time from the estimation date. Generational shocks, a Blackwell release, say, reprice the forward curve immediately and separately; the decay curve itself represents the slower, gradual erosion as newer architectures absorb workloads over time. Starting utilization gets set at the point of mass availability for that generation, anchored there instead of the individual operator's purchase date, which keeps the model consistent with the technology-age discipline established at acquisition.
There's a sanity check buried in the hardware economics themselves, and it's the one most models skip: payback urgency. An H100 server costing $250,000 to $300,000 has to generate $15,000 to $25,000 in monthly revenue, which implies 60 to 80% utilization at prevailing rates, to hit a 12 to 18 month payback window. Any utilization assumption implying a faster payback than the market rate actually supports should be treated as fiction until proven otherwise.
Operating cost gets deducted as a fixed ratio covering power, rack space, and labor. Regional variation here is real (a facility in Iceland and one in Virginia face very different power costs), but the model runs on a blended global average as baseline, and operators with known site-level costs should layer their own modifiers on top. Idle hardware still depreciates and still owes interest on whatever financed it, so a utilization shortfall hits the income statement twice: once through lost revenue, once through the interest and depreciation that keep accruing regardless of whether the chip ever runs a job. That double exposure is exactly why the neocloud business model is so sensitive to this one parameter. The discount rate itself combines the utilization factor with an interest rate, so utilization ends up doing double duty, scaling the rental income directly while also feeding the discount applied to that income.
Maximum physical life needs a bound too. Silicon Data sets that outer limit at roughly 8 years, based on historical end-of-life data drawn from hyperscaler disclosures on the P100 and V100 generations. In practice, that ceiling almost never binds. If a generation obsoletes faster than expected, the utilization and rate inputs will already have driven the residual toward zero well before the model reaches the 8-year mark, which is the economic reality asserting itself ahead of whatever assumption was meant to describe it.
Sources
- GPU Residual Value | Silicon Data
- GPU Residual Value: Underwriting a $3 Trillion Opportunity | American Compute
- GPU Residual Values 2026: The UK Depreciation Study
- GPU as an Investment in 2026: ROI, Depreciation & Compute as an Asset Class | GPUnex Blog
- GPU Depreciation Meaning: How Fast AI GPUs Lose Value, the Generational Step-Down and What It Does to GPU-Backed Debt | AltStreet
- danieljeffreykoch.substack.com
- ir.theice.com
- intuitionlabs.ai